I first presented this discussion on my own podcast on March 31, 2026 – The Games Memo for 3/31/2026 – The Uncomfortable Truth About Gaming Affordability
And presented it a second time on April 1, 2026 on a second show – Are Video Games Becoming a Luxury Item?!
Events were triggered in the mid-1960s that culminated in a bow wave of buyers whom consoles could be sold to 3 decades later, in the 1990s. Ten years after that, those buyers were giving rise to the opportunity for a second round of explosive growth in the market, one that would be more beneficial to the platform owners of the 2000’s, now that there were fewer competitors than there had been before.
This is a detailed discussion of the history of the gaming industry and the socioeconomics in the United States that enabled The Great Age of Affordable Gaming; an era that lasted from 2005 until 2020. And that contextualizes today’s fifth age of the gaming market’s evolution and provides reasons why and describes how we have entered The Long-Lasting, Quasi-Perpetual Bubble. The bubble that may not collapse, but will offer less stability to traditional market sub-segments, and much more greatly fragment and stovepipe the industry.
First things first; we need to level set some definitions of terms, because the internet screws these up all the time, myself included. The first key ones are disposable income and discretionary income and the difference between the two. Disposable household income is money left after taxes, used for all living expenses. Discretionary household income is the smaller amount remaining after paying taxes and essential living expenses (housing, food, utilities). Disposable is total “take-home” pay; discretionary is “fun money” for savings or luxuries.
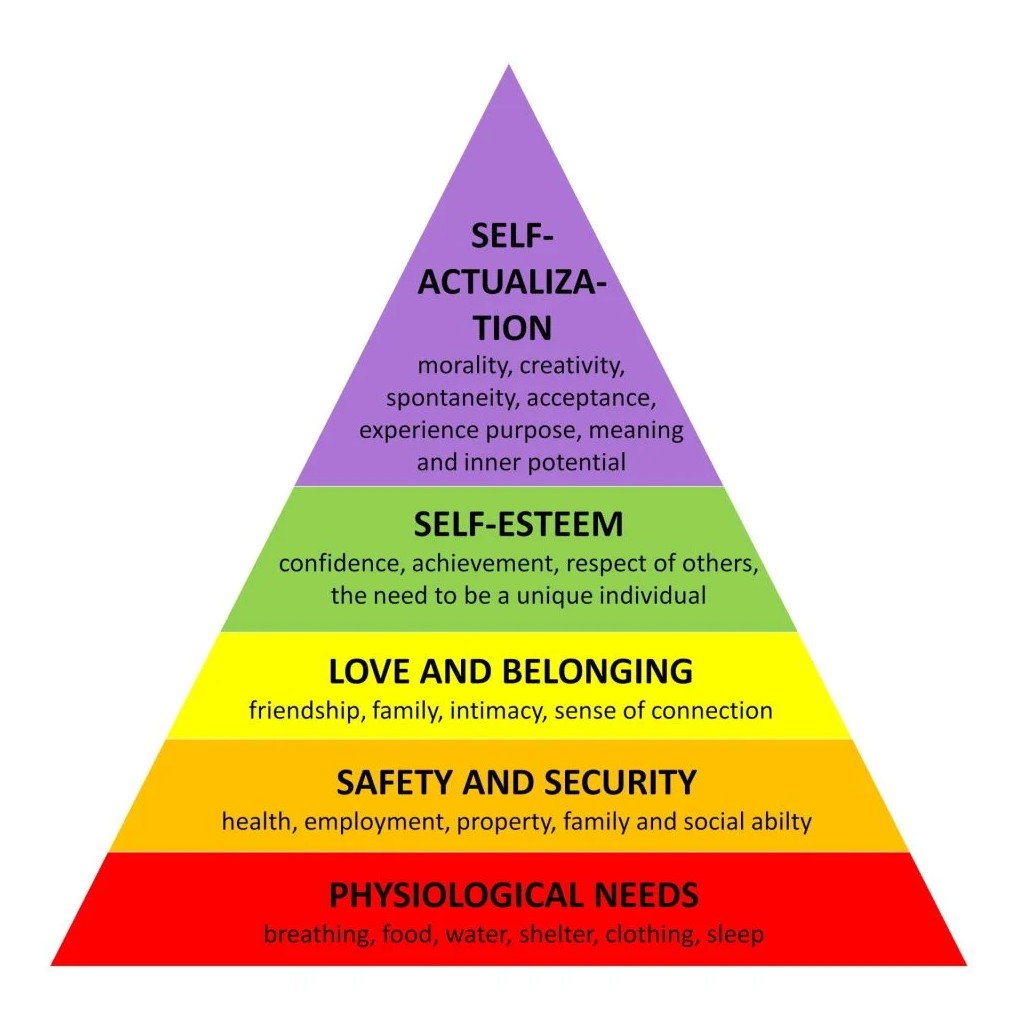
Second, we need to cover Maslow’s Hierarchy of needs, because a lot of people have it mistaken in their view that playing video games is not a luxury; Americans in particular suffer from a horrendous case of decompression sickness that warps their minds and makes them think 1st world problems are all the worlds problem. “Maslow’s hierarchy of needs is a motivational theory in psychology comprising a five-tier model of human needs, often depicted as hierarchical levels within a pyramid. Needs lower down in the hierarchy must be satisfied before individuals can attend to needs higher up.”
When we talk about things, even in America, that are entitlements that we believe all Americans should have access to, we have propped up systemic, institutionalized means that have fixed those items upon our society. A great example was when, under Obama, ISP’s were designated as common carrier services, reclassifying them as Title II services. A ruling that was overturned, but then restored in 2024. What this means, despite a ruling in 2025 that established precedent that net neutrality, a subordinate principal of making the ISPs common carriers, was overreach for the FCC, is that all Americans are entitled to internet access. Cell Carriers, in terms of mobile broadband, are considered part of the common carrier pool, but the carriers themselves are designated as a private mobile service, meaning all Americans are not entitled to cell phone service. But if you have cell phone service, you are entitled to mobile broadband.
We have also institutionalized access to art for all of society, but gaming is yet to be included in that pool. Western society and America has decided people should have universal access to certain art forms. Books. Static art…paintings and sculptures. Music. But not games yet in terms of provisioning of the hardware to access it. Your public library, a common service funded by a mix of tax sources (local, state, and federal), and therefore voted into being by the American people, provides this access. Basically anything that is provided by public libraries is a thing we have, as a society, decided people have a right to access. Ditto for most tax-funded museums.
And so, acutely, this article is primarily to discuss the affordability of gaming and how it is changing in the face of rising hardware prices, and to a lesser extent software prices, gating the access to gaming for some people. So the level-set is that gaming has always been a luxury.
It has changed in its affordability over time, being unaffordable, then affordable, and now becoming unaffordable again. But throughout that time, it has always been a luxury; a thing that is not essential or an entitlement in institutionalized terms in the United States. I use these terms with all of the requisite caveats as a thing that should be understood. “More” or “less affordable”, More affordable ” for some”, less affordable “for others”.
So let’s start the history work. How is it possible that gaming began as something unaffordable if it was cheaper? “Cheaper” is a matter of great debate, won mostly by economists who convert the dollars at the time to current-day dollars. The principles of inflation and the constantly decreasing value of the dollar means that, mostly, it will always mathematically come out as near-equal over time; meaning that, for the most part, when you adjust for inflation, gaming will always seem about the same net cost as it has always been. If anything, economically, it has been cheaper. But even if you think gaming was “more affordable” in the 70s and 80s, I think what is more important is to discuss it in terms of just who it was “more affordable” for. And then adjudicate your perception as a net of the total population.
Along the way, we’re going to continue defining (debunking) the use of terms that get twisted that actually have very specific economic definitions. Let’s first talk about what is meant to be to be “middle-class”. Being middle class generally means having a household income that is two-thirds to double the median. The U.S. median household income was approximately $83,730 in 2024. Today, economists show this bracket as typically ranging from roughly $50,000$ to $150,000+ annually, depending on location. In discussion, I typically use $170k as the upper band. It is characterized by financial stability, the ability to afford moderate luxuries (vacations, dining out), and reliance on credit for major assets like homes and cars.
Key Aspects of the Middle Class:
Income Ranges: While definitions vary, in 2023, the national middle-class household income was generally defined between roughly $53,740 and $161,220.
Cost of Living Adjustments: The definition shifts based on location and household size. For example, 2025 analysis shows in high-cost states like Massachusetts, a four-person household could need over $170,000 to be considered middle class.
Key Characteristics:
Financial Stability: The ability to save for retirement and handle unexpected expenses.
Education and Career: Often includes individuals with college degrees or those in professional/salaried roles.
Consumer Habits: Access to quality healthcare, homeowners (or aspiring homeowners), and ability to afford amenities.
So when you talk about this definition, and choose to make an assertion like “gaming was more affordable in the ’70s and ’80s”, an assertion which is, inherently, based on who was in the middle class….was everyone in that pool in the ’70s and ’80s? Most decidedly not.
Two key events happened in the 1960’s. The Civil Rights Act of 1964 begat a series of US codes that were designed to level the playing field for all people in the workplace, having especially impactful results along racial and gender lines. In 1965, the Higher Education Act strengthened federal funding for HBCUs. But it also introduced the modern form of Federal Student Aid, added federal funds for continuing education, provided federal funds to recruit teachers to underserved schools (thereby raising the academic competitiveness of students within those schools), impacting admissions policies for colleges in an effort to end discriminatory practices.
Since then, a few enabling effects occurred on the path from the 1960s to the 1990s.
High School Completion: The Black high school dropout rate fell from 33% in 1968 to 5% in 2018, essentially closing the gap with the national average.
College Attainment: From 1960 to 1991, the percentage of Black males (25-29) completing at least 4 years of college rose from 12% to 18%.
HBCU Economic Mobility: HBCUs, strengthened by 1965 federal recognition, act as major upward mobility engines. Graduates from these institutions are 14.6 percentage points more likely to earn a BA than comparable peers, and 70% of their graduates reach the middle class or above.
Income Premium: Ten years after graduation, first-generation HBCU graduates have income levels on par with non-first-generation graduates.
Shift from Labor to Professional Roles: Post-1964, Black workers saw increased access to white-collar jobs, moving away from manual labor jobs where they were previously segregated.
Federal Sector Representation: In FY 2020, African American women made up 11.7% of the civilian Federal workforce, nearly twice their participation in the Civilian Labor Force (CLF).
Income Growth: Real median household income for Black households has risen since the late 1960s.
Record Highs: In 2023, Black median household income reached its highest point in a generation.
Dual-income households increased significantly between the mid-1960s and mid-1990s as more women entered the workforce. While less than half of married couples were dual-earners in the 1960s, this increased from roughly 30% of families in 1970 to over 50–60% by the 1990s. By 1994, this surge made dual-income households a common structure in the US.
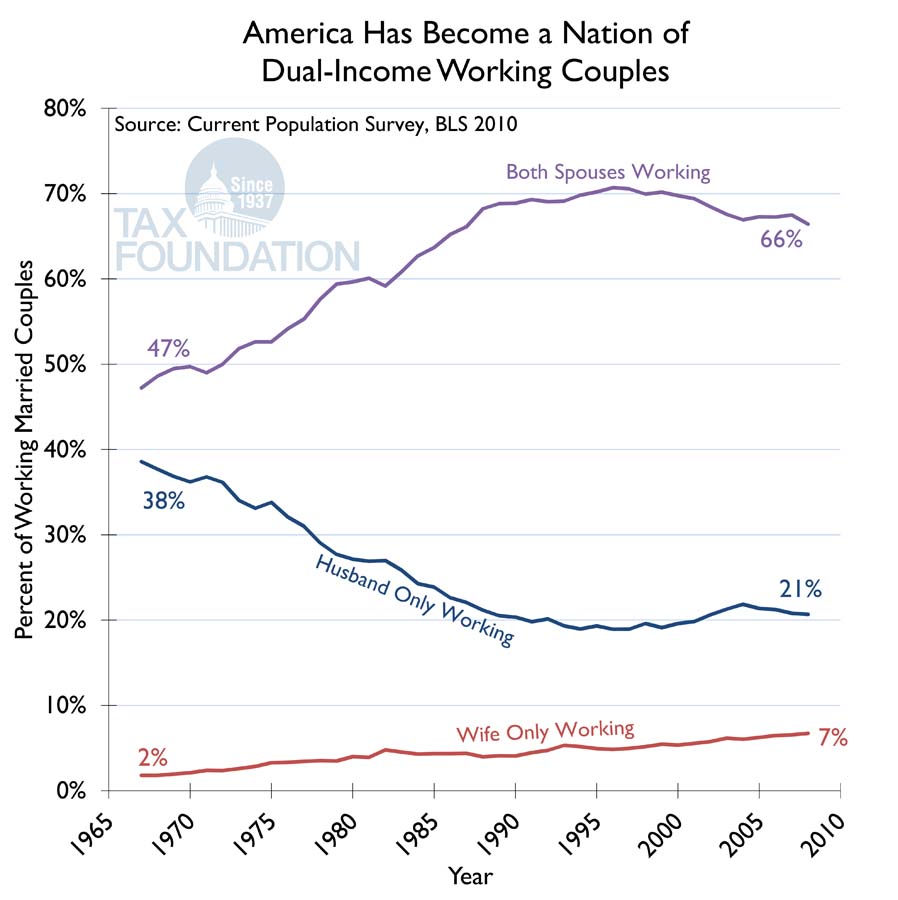
1960s Context: In the 1960s, the “sole-breadwinner” household was not the strict norm, but dual-earner couples were still less than half. Data for 1967 shows 44% of married-couple families had earnings from both spouses.
The Shift: From the 1970s onwards, the trend grew rapidly. By 1994, the trend was firmly established, heading toward the 66% level observed in the following decades.
*** Impact ***: By 1994, the increase in dual-income couples resulted in a higher concentration of income in the upper income quintiles, as many households had two earners.
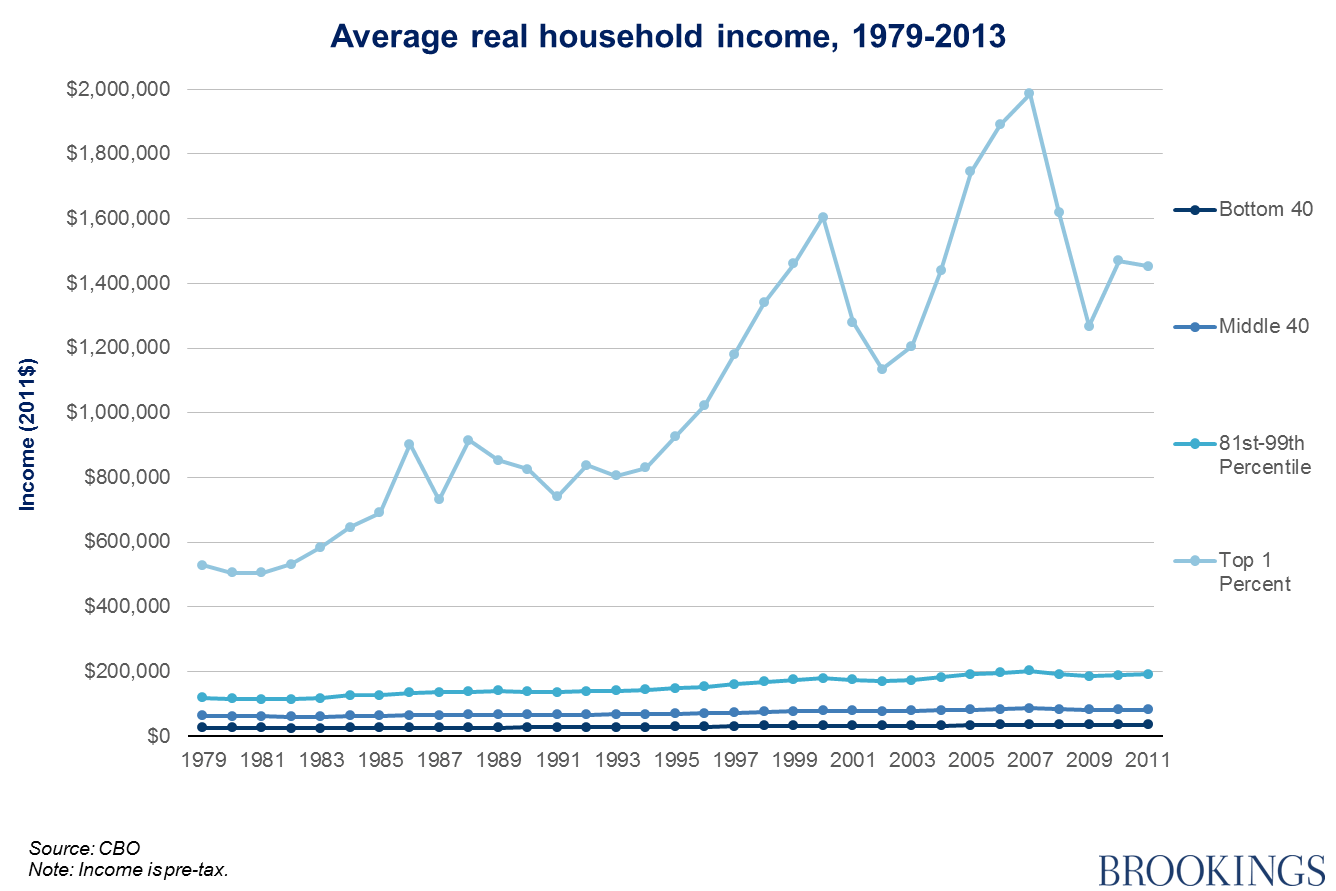
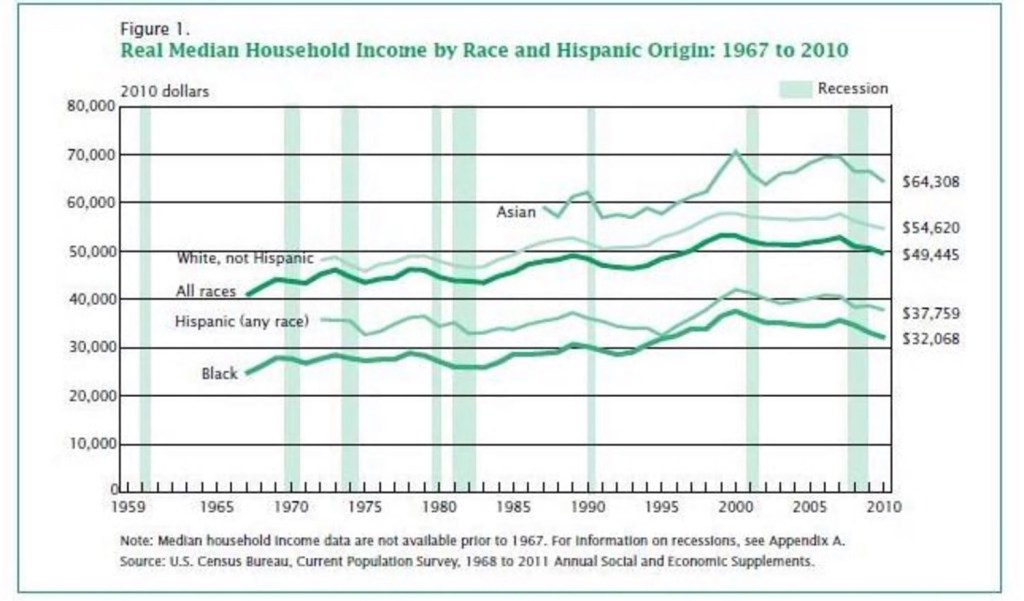
While this was occurring, a second dynamic was starting to take place beneath the surface. While it was true that there was an increase in the percentage of dual-income earning households, an increase in racial minorities and women entering the professional salaried ranks, and a modest increase in the wages of the middle-class, a secondary effect began swirling that really became a catalyst. That was a diverging hockey-stick effect altering wealth equity in the country. The really wealthy, not the middle class, but the band that we call upper-income, began accruing wealth in an uneven distribution ratio in comparison to the middle-class. In essence, the rich were getting richer, and at a rate well-exceeding the ability of the middle-class to keep up. Now, before we think “upper-income” means the Elon Musks and members of the billionaires club. Today, Upper-income households in the US are generally defined as those earning more than double the national median, starting at over $167,460 to $169,800 annually for a three-person household, according to Pew Research. More elite tiers start higher, with top 10% earners starting at $251,040+ and the top 1% at $659,060+.
So, in the 1990s, you had high median household income growth (10% over the decade), record stock market growth (Dow Jones up 309%), and a steady decline in the poverty rate (reaching 11% in 2000). The late 90s experienced a rapid productivity surge, low inflation, and a surge in household wealth. And despite the increasing divorce rate in the US, Women’s participation in the workforce grew to 60% by the end of the 1990s, with their income relative to men’s increasing. The share of high-income households increased dramatically. In 1967, only about 9% of US households earned $100,000 or more (in 2017 dollars), but by 1990 this had risen to over 15%, with continued rapid growth throughout the 1990s.
These are the conditions that led to a commensurate boom in the video games industry that began in the 1990s. The convergence of explosive growth in the combined middle-class and upper-income households that home video game consoles could be sold to; a burgeoning increasingly larger addressable market, converged and reached critical mass. While the video games market in the US would only support two set-top console competitors from 1985 – 1994, the mid-90s saw a time when the market was willing to support 3 main console competitors (Nintendo, Sega, and PlayStation), and 5 second-ring competitors, albeit for a short time (3DO, Philips CD-i, Neo Geo, Turbo Grafx, and the Atari Jaguar). There is a reason that these consoles were supported and the landscape of the console gaming market radically changed in the 1990s. It didn’t just happen by sheer chance and industry force of will.
Between 1994 and 2005, this support buckled, with the market telegraphing that it was only willing to support three console vendors. The second-ring competitors all failed out. And Sega also became a casualty of market demand (and its own mis-steps). It would be Xbox, PlayStation, and Nintendo that would create the new 3-front war. But those diverging economic hockey-sticks that started in the 90s create a new problem. The rate of increase of dual-income households had flattened out by 2005. While the upper-income households were continuing to earn more, the middle-class was barely keeping up. And so, in order to maintain industry growth, we entered The Great Age of Affordable Gaming (2005 – 2020). A time period where, whether sub-consciously or deliberately, the platform owners kept pricing relatively flat, with very little increases in hardware prices across three generations of consoles, and no increases in the stock price of the primary SKU in retail gaming software. This despite rising production costs for games.
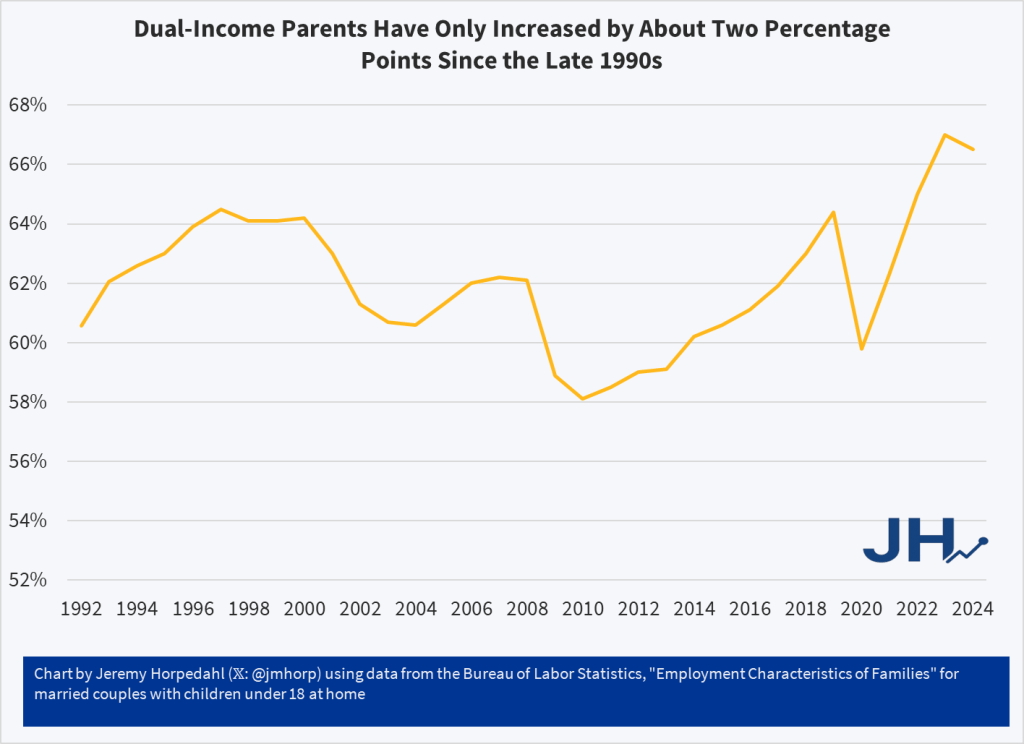
Today “…one-third of families in the US have incomes greater than $150,000. This is a massive increase since the 1960s, or even since the 1980s.” (“The Growth of Family Income Isn’t Primarily Explained by the Rise of Dual-Income Families” – https://economistwritingeveryday.com/2025/11/12/the-growth-of-family-income-isnt-primarily-explained-by-the-rise-of-dual-income-families/).
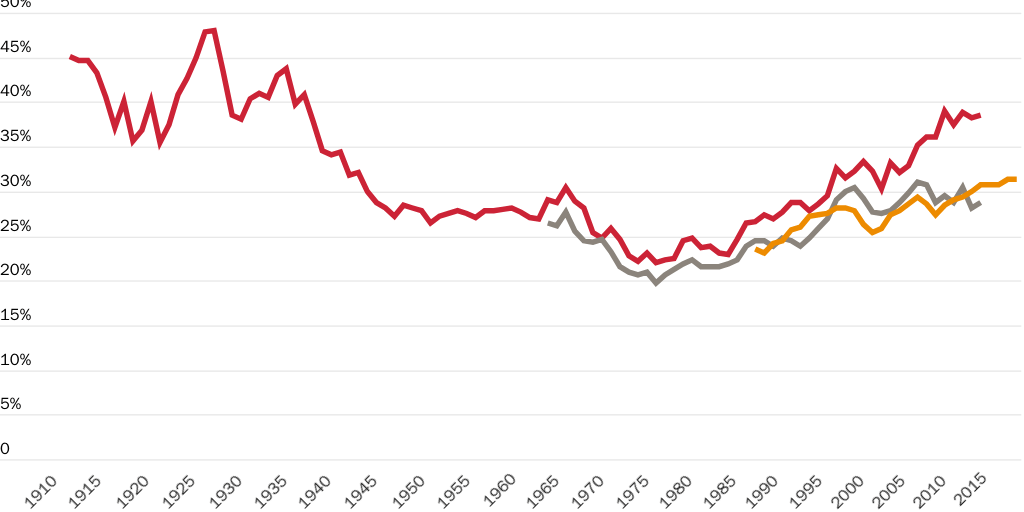
Those diverging hockey-sticks, what was coined as the “K-shaped economy” by economist Peter Atwater in 2020 in reference to dynamics we saw during the pandemic recovery period (but has really been going on since the 1990s; it was exacerbated and accelerated by the rise of the knowledge worker in the shift in the American employment landscape since 2000), has led to an effect in the 5th Economic Age of the Games Industry. Underpinning that age are facts like “In the past five years, the top 10% of U.S. households gained more wealth than the bottom 90% combined—even after accounting for all those circa-2020 stimulus checks and wage gains.”
What also needs to be understood is that while the Upper-Income bands are garnering more of the net wealth, they are also increasing as a net percentage of all American households. Upper-income households were 14% of US households in 1971, 18% in 1991, and are now 30 – 33%. The middle-class households were 61% in 1971, 56% in 1991.
“The economics are important… But it’s how people now feel that matters most. As we see so often in history, when people feel powerless and uncertain, it impacts their political and social choices, not just what and how much they buy.” —Economist and adjunct professor Peter Atwater, speaking to W&M News.

And that is what is going on now in terms of the responses that pepper the landscape of social media with regards to the rising prices of video gaming. It is mainly about how people feel, and in that, what needs to be acknowledged and recognized is that the reactions are not everyone’s. And not just social media, but in real-world terms of how the market has, is, and will act. For the middle-classs, they are experiencing a thing called “The Squeeze”. They are experiencing an acute contraction in their earnings, largely due to rising costs for housing, healthcare, and education exceeding wage growth. While six-figure incomes were once firmly upper-middle class, they are increasingly becoming the standard for middle-class status in many U.S. states. And the buying power in that band is under siege. Meanwhile, as I’ve been saying for four years, and as corroborated by Circana data months ago, the Upper-Income households continue to spend. The Great Age of Affordable Gaming is over. Since 2020, we have entered The Long-Term Quasi-Perpetual Bubble, a 5th age in the economy of the gaming market & industry. A period of time when the industry is mostly moving forward on the support of the Upper-Income bands, with less support from the middle-class.
It is a bubble that could burst at any time. I don’t think it will. I think it will deflate a little, in very specific slices of where certain vendors operate in the market demographics. And there will be winners and losers in whose specific slice deflates, who remains afloat, and who needs to pivot, some of which you are already seeing. You can read about what that future looks like in the two articles I previously published:
Welcome to the Suck: Console Players Meet the PC Market Reality
